 ASVAB Camp
Learning outcomes, scope and the GS exam connection
By the end of this lesson you should be able to sort living systems into levels from a single organism up to the biosphere, tell living (biotic) factors from nonliving (abiotic) ones, and read a food chain or food web by following its arrows. You will trace energy as it moves through trophic levels and track how carbon, nitrogen, phosphorus and water cycle. You will also calculate population change and density, and name relationships such as competition, predation, parasitism and mutualism.
On the General Science test, ecology questions are usually short and rely on vocabulary plus one step of reasoning. The examples here are practice items written for this course. They are not official test questions and do not show how much of the test covers ecology.
Ecology is the science of interactions
Ecology studies how organisms interact with each other and with their surroundings. Those surroundings include other living things, such as prey, rivals and partners. They also include physical conditions such as light, temperature, water and soil chemistry.
Picture a beaver building a dam. The dam slows the stream and floods a meadow. The new pond warms in summer, fish move in, herons come to hunt the fish, and the trees killed by the flooding become homes for insects and woodpeckers. One animal's activity changed the water, the plants and the animals. Ecology is the study of that whole web of connected effects, not of any single organism on its own.
Five levels of ecological organization
Ecologists group living systems into nested levels, and each level contains the one below it.
An organism is one individual, such as a single bluegill fish. A population is all the members of one species living in the same area at the same time, such as every bluegill in a particular lake. A community is all the populations of different species sharing that area: the bluegill plus the bass, frogs, cattails, algae and bacteria. An ecosystem is the community together with its nonliving surroundings, such as water temperature, sunlight, dissolved oxygen and sediment. The biosphere is every ecosystem on Earth taken together.
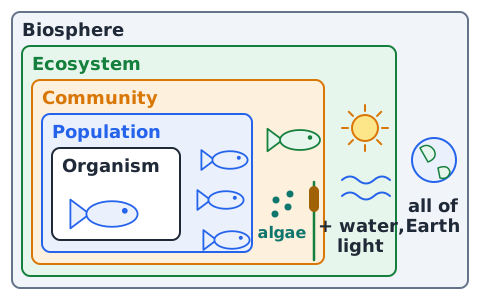
A quick test: one species means population, several species means community, and living things plus physical conditions means ecosystem.
Example 1 — population or community?
Problem: A survey of a prairie plot lists 85 prairie dogs, 3 badgers, 12 meadowlarks, many grasshoppers and several kinds of grass. Does the survey describe a population or a community?
Step 1: Count the species. Prairie dogs, badgers, meadowlarks, grasshoppers and grasses are clearly more than one species.
Step 2: Check for nonliving factors. None are listed, so the survey is not an ecosystem description.
Answer: a community. If you kept only the 85 prairie dogs, you would have a population. If you added rainfall and soil type to the list, you would have an ecosystem.
Biotic versus abiotic factors
Biotic factors are the living parts of an environment, along with things that come directly from living things, such as fallen leaves or animal waste. Plants, animals, fungi, bacteria, predators, parasites and food supply are all biotic.
Abiotic factors are nonliving physical and chemical conditions. Common examples are temperature, sunlight, rainfall, wind, soil texture, pH, salinity and the amount of oxygen dissolved in water.
Take a desert. The cactus, the kangaroo rat and the rattlesnake are biotic. The intense sunlight, sandy soil, low rainfall and the big temperature swing between day and night are abiotic. A test question might ask which item in a list is abiotic. Pick the one that has never been alive, such as a dissolved-gas level or a temperature.
Habitat is location; niche is function
A habitat is the place where an organism lives, with the conditions it needs. A niche is the role the organism plays there: what it eats, what eats it, when it is active, and how it uses resources.
Think of a barn owl. Its habitat is open farmland and grassland with barns or hollow trees for nesting. Its niche is a nighttime hunter of small rodents that also serves as food for larger predators and spreads nutrients through its pellets.
One way to remember it: the habitat is the organism's address, and the niche is its job.
Ecosystem energy usually begins with sunlight
Almost every ecosystem runs on energy that started as sunlight. Plants, algae and some bacteria capture light energy and store it in the chemical bonds of sugar. Every organism that eats those producers, or eats something that ate them, depends on that stored energy.
Consider a farm field. Sunlight strikes the corn leaves, and the plant uses that energy to build sugars and starch. A corn borer caterpillar eats the leaves, a bird eats the caterpillar, and a hawk eats the bird. Each feeding step passes along part of the energy that was first captured from sunlight.
There are exceptions. Some deep-sea communities get their energy from chemicals rather than light, as the next section explains.
Autotrophs and primary producers
Autotrophs make their own food from simple inorganic materials. Ecologists call them primary producers because they bring energy into the food web.
Most producers carry out photosynthesis, using light energy to turn carbon dioxide and water into sugar and releasing oxygen. Grasses, trees, seaweed, phytoplankton and cyanobacteria are all photosynthetic producers.
Some microbes are chemosynthetic producers. Near deep-ocean hydrothermal vents, where no sunlight reaches, certain bacteria get energy from chemicals such as hydrogen sulfide and use it to build sugars. Tube worms and clams there depend on them. Producers also carry out cellular respiration, because they need to release the energy stored in their own sugars.
Heterotrophs and primary consumers
Heterotrophs cannot make their own food. They get energy and carbon by eating other organisms or their remains. Every animal and fungus is a heterotroph, and so are many bacteria.
A primary consumer eats producers directly. Herbivores fill this role: a grasshopper chewing on grass, a deer browsing on twigs, a manatee grazing on seagrass, or tiny zooplankton filtering algae out of seawater. In a chain such as clover, then rabbit, then fox, the rabbit is the primary consumer because it is one feeding step above the producer.
Secondary and tertiary consumers
A secondary consumer eats primary consumers, and a tertiary consumer eats secondary consumers. These labels describe the position in a particular chain, not a fixed property of the species.
In the chain seeds, then field mouse, then snake, then hawk, the mouse is the primary consumer, the snake is the secondary consumer and the hawk is the tertiary consumer.
Many animals feed at more than one level. A bear that eats berries is acting as a primary consumer, and the same bear eating a salmon that ate smaller fish is acting at a higher level. When a question gives a specific chain, count the steps from the producer within that chain.
Example 2 — identify the tertiary consumer
Problem: In the chain phytoplankton, then krill, then cod, then harp seal, then polar bear, which organism is the tertiary consumer?
Step 1: Find the producer. Phytoplankton photosynthesize, so they are the producers.
Step 2: Count the feeding steps. Krill eat phytoplankton, so they are primary consumers. Cod eat krill, so they are secondary consumers. Harp seals eat cod, so they are tertiary consumers.
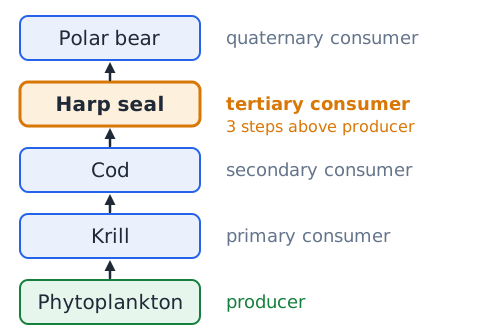
Answer: the harp seal. The polar bear sits one step higher, as a quaternary consumer. A common mistake is choosing the top predator without counting.
Food chains are simple; food webs are networks
A food chain follows one single path of energy, such as acorns, then squirrel, then red-tailed hawk. Chains are handy for counting trophic levels, but they leave a great deal out.
A food web joins many chains that overlap. In a real woodland, squirrels also eat seeds and fungi; hawks also eat mice, rabbits and snakes; and foxes compete with hawks for some of the same prey. A web shows these several feeding links at the same time.
Because of those cross-links, a web helps predict what happens when one species changes. A predator with several prey can switch foods when one prey becomes scarce. A predator that depends on a single prey has no such backup.
Arrows show the direction of energy transfer
In food chains and food webs, each arrow points from the organism that is eaten to the organism that eats it. The arrow shows where the energy and matter go, not who is chasing whom.
So in seaweed, then sea urchin, then sea otter, the arrow from urchin to otter means energy stored in the urchin's body moves into the otter when the otter eats it.
To read a web, find the arrows that point into an organism; those come from its food sources. Arrows that point away from it go to the organisms that eat it. A producer has no arrows pointing in from other organisms.
Example 3 — predict a change in a food web
Problem: In a pond web, algae are eaten by snails and by tadpoles. Snails are eaten by crayfish. Tadpoles are eaten by both crayfish and herons. A disease wipes out most of the snails. What is the most reasonable prediction?
Step 1: Find who ate snails. Only crayfish did.
Step 2: Check for backup food. Crayfish still have tadpoles, so they may eat more tadpoles than before.
Step 3: Look one step further. More crayfish feeding on tadpoles could leave fewer tadpoles for herons, while algae may increase because fewer snails graze on them.
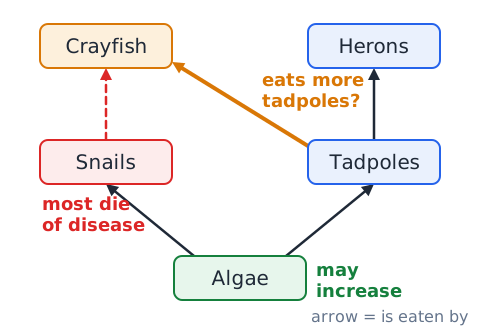
Answer: crayfish lose one food source and may shift toward tadpoles, so effects spread through the web. They will not simply all die.
Decomposers recycle nutrients
Decomposers break down dead organisms and wastes into simple inorganic substances. Most decomposers are bacteria and fungi. They release digestive enzymes into the dead material and absorb the small molecules that result.
This work returns nutrients such as nitrogen, phosphorus and potassium to the soil and water, where plant roots and algae can take them up again. Without decomposers, those nutrients would stay locked in dead leaves, logs and carcasses, and producers would eventually run short even with plenty of sunlight.
Examples: shelf fungi growing on a fallen log, mold on rotting fruit, and soil bacteria breaking down a dead mouse. Decomposers also release carbon dioxide as they respire.
Detritivores are not identical to decomposers
Detritivores are animals that eat detritus, meaning dead plant and animal material. Earthworms, millipedes, woodlice, dung beetles and some crabs are detritivores. They swallow pieces of dead matter and digest them inside their bodies.
Decomposers, mainly fungi and bacteria, work differently. They digest material outside their bodies by releasing enzymes, then absorb the dissolved nutrients.
The two groups help each other. When a millipede chews a leaf into tiny bits, it creates much more surface area, so fungi and bacteria can finish the breakdown faster. On a test, a fungus on a log is the usual example of a decomposer, while a worm eating leaf litter is better described as a detritivore.
Energy transfer decreases at higher trophic levels
At each feeding step, only a small share of energy is stored in the next organism's body. Most of the energy an animal takes in is used for movement, body heat and staying alive, and in the end it leaves as heat. Some food is never eaten or digested, such as bones, bark and roots.
Introductory courses often use a rough 10 percent rule: about one-tenth of the energy at one level becomes available to the level above. Real efficiencies vary, often between about 5 and 20 percent, depending on the organisms and the ecosystem.
Because so much energy is lost at each step, food chains rarely have more than four or five levels. There is too little energy left at the top to support another layer of predators.
Example 4 — energy pyramid using a stated 10% model
Problem: A grassland's producers store 20,000 kilocalories of energy. Using a 10 percent transfer model, how much energy reaches the tertiary consumers?
Step 1: Primary consumers get 10 percent of 20,000, which is 2,000 kcal.
Step 2: Secondary consumers get 10 percent of 2,000, which is 200 kcal.
Step 3: Tertiary consumers get 10 percent of 200, which is 20 kcal.
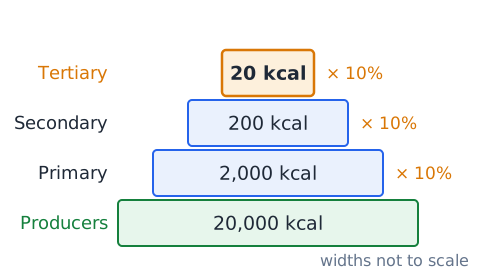
Answer: 20 kcal. A shortcut is to move the decimal point one place to the left for each step up. The 10 percent figure is a stated assumption in the problem; if a question gives a different percentage, use that one.
Pyramids of energy, biomass and numbers differ
Ecologists use three kinds of pyramid. An energy pyramid shows the energy available at each trophic level over a period of time. It always gets narrower toward the top, because energy is lost at every step.
A biomass pyramid shows the total mass of living material at each level at one moment. It is usually upright, but in some oceans it is inverted: tiny phytoplankton reproduce so quickly that a small standing mass can feed a larger mass of zooplankton.
A pyramid of numbers counts individual organisms. It can also be inverted. One oak tree can support thousands of caterpillars, which then feed a smaller number of birds.
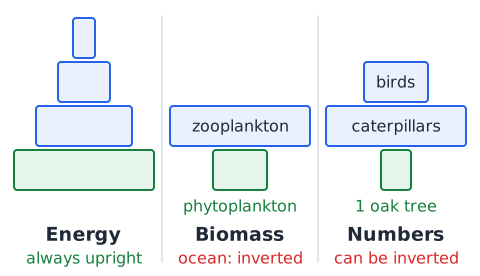
Only the energy pyramid is reliably upright.
Matter cycles; energy flows through
Matter and energy behave differently in ecosystems. Atoms of carbon, nitrogen, phosphorus and other elements are used over and over. A carbon atom in a blade of grass may later be part of a cow, then exhaled as carbon dioxide, then taken in again by a tree.
Energy follows a one-way path. It arrives as sunlight, is stored in chemical bonds by producers, passes up the food chain, and at each step part of it is converted to heat that escapes to the surroundings. That heat cannot be used again by producers to make food.
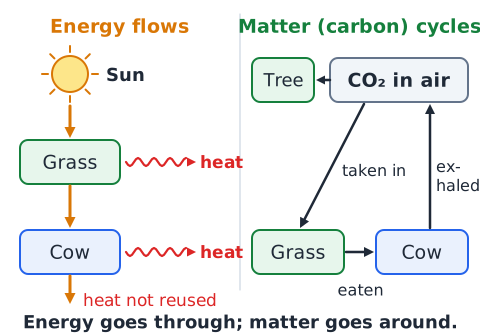
So ecosystems need a constant supply of new energy, mostly from the Sun, while their matter is recycled. Energy is not destroyed; it changes into heat that living things cannot use.
The water cycle connects ecological habitats
Water moves constantly between the oceans, the air, the land and living things. The Sun heats surface water, which evaporates into vapor. Plants also release water vapor from their leaves in a process called transpiration. As the vapor rises and cools, it condenses into clouds, and eventually falls as precipitation: rain, snow, sleet or hail.
On land, water may soak into the ground and recharge groundwater, run off into streams and lakes, or be taken up by plant roots. Rivers carry it back to the sea.
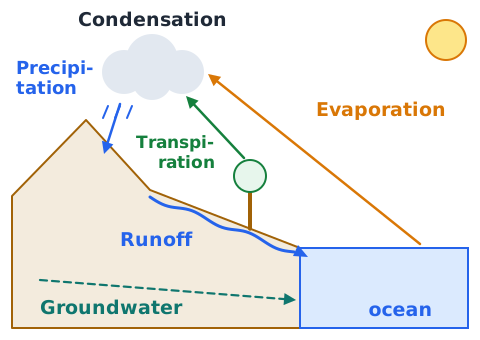
The cycle links habitats. Rain on a mountain forest feeds the streams below, carrying dissolved minerals and sediment to wetlands and coastal estuaries far downstream.
The carbon cycle links photosynthesis and respiration
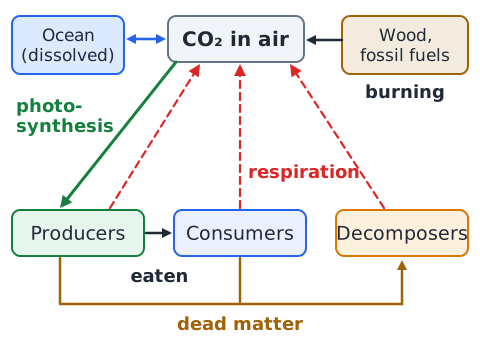
Carbon enters living systems mainly through photosynthesis. Producers take in carbon dioxide from the air or water and build it into sugars and other organic molecules. Consumers obtain that carbon by eating producers or other consumers.
Carbon goes back to the atmosphere through cellular respiration, which almost every organism carries out, including plants. Decomposers release carbon dioxide as they break down dead matter. Burning wood or fossil fuels also releases stored carbon quickly.
Some carbon is stored for a long time: in wood, in deep soils, in limestone rock and in fossil fuels such as coal and oil. The oceans dissolve large amounts of carbon dioxide as well, making them a major carbon reservoir.
Example 5 — carbon cycle interpretation
Problem: A sealed glass jar holds a small water plant, a snail and pond water, and it sits on a sunny windowsill with natural day and night. A sensor shows dissolved carbon dioxide dropping during the day and rising at night. Explain the pattern.
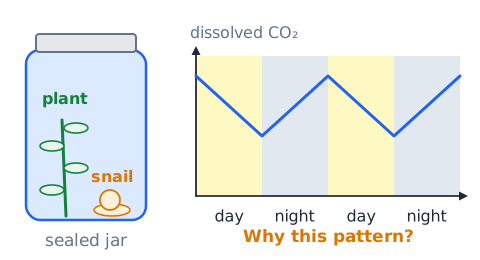
Step 1: In light, the plant photosynthesizes and removes carbon dioxide faster than the plant and snail together release it through respiration.
Step 2: In the dark, photosynthesis stops, but both organisms keep respiring, so carbon dioxide builds up.
Answer: daytime uptake by photosynthesis outweighs respiration; at night only respiration happens. The same carbon atoms move back and forth between the water and the organisms.
Nitrogen is essential but atmospheric N₂ is not directly usable by most plants
Living things need nitrogen to build proteins, DNA, RNA and ATP. Air is about 78 percent nitrogen gas, , so it might seem that nitrogen should never be in short supply.
The problem is the chemical bond. The two nitrogen atoms in are held by a very strong triple bond, and plants and animals cannot break it. Plants instead take in nitrogen from the soil in forms such as ammonium and nitrate. Animals get their nitrogen by eating plants or other animals.
That is why nitrogen often limits plant growth, and why farmers add nitrogen fertilizer. A pale, yellowing cornfield on poor soil can be a sign of a nitrogen shortage, even though the air around the plants is full of nitrogen gas.
Nitrogen fixation, nitrification and denitrification
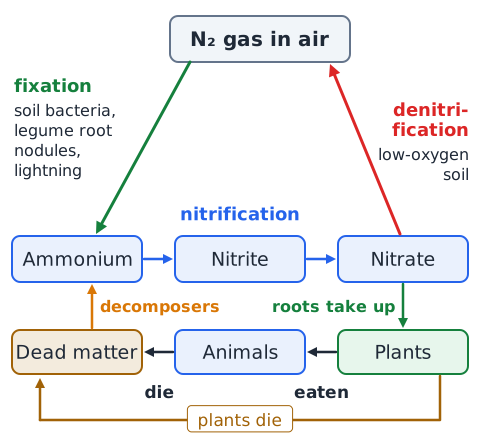
Nitrogen fixation turns nitrogen gas from the air into ammonia or ammonium, forms that living things can use. Certain bacteria do this. Some live freely in the soil, and others live in nodules on the roots of legumes such as clover, beans and alfalfa. Lightning and industrial fertilizer plants also fix nitrogen.
Nitrification is carried out by other soil bacteria, which convert ammonium first to nitrite and then to nitrate. Plants readily absorb nitrate through their roots.
Denitrification runs the other way. In waterlogged, low-oxygen soils, bacteria convert nitrate back into nitrogen gas, which returns to the air. Decomposers also release ammonium from dead matter, which links the cycle back to the soil.
Phosphorus cycling often involves rock and soil
Phosphorus is part of DNA, RNA, ATP, cell membranes, bones and teeth. Unlike carbon and nitrogen, it has no significant gas form, so the atmosphere plays almost no role in its cycle.
The main reservoir is rock. As rain and weather slowly break down rock, phosphate is released into soil and water. Plants absorb the phosphate, animals get it by eating plants, and decomposers return it to the soil when organisms die. Some phosphate washes into lakes and the ocean and settles into sediments, which over very long periods can become rock again.
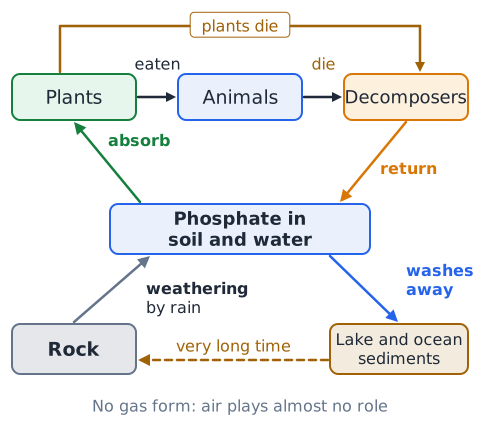
Because weathering is slow, phosphorus is often a limiting nutrient, especially in freshwater lakes.
Population size depends on four direct flows
Only four things directly change the size of a population. Births and immigration (individuals moving in) add members. Deaths and emigration (individuals moving out) remove members.
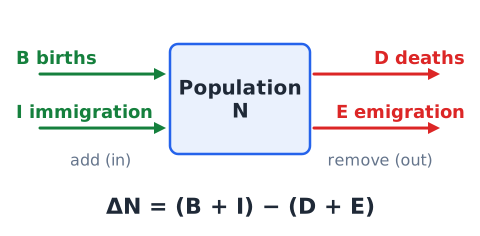
Here is the change in population size, B is births, I is immigrants, D is deaths and E is emigrants, all counted over the same period. If the result is positive, the population grew; if negative, it shrank.
A population can stay nearly constant even while births and deaths keep happening, as long as the gains and losses roughly balance.
Example 6 — calculate net population change
Problem: A herd of elk numbers 400 at the start of a year. During the year there are 60 births, 45 deaths, 12 elk join from a nearby range and 7 leave. What is the herd size at year's end?
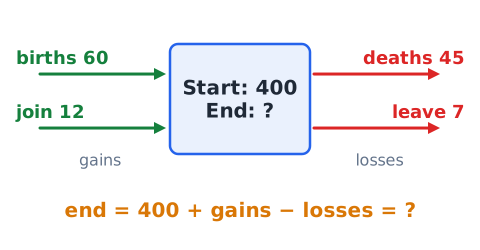
Step 1: Gains are
Step 2: Losses are
Step 3: Net change is 72 minus 52, which is +20.
Answer:
elk. Group the two additions and the two losses before you combine them; that avoids sign mistakes.
Population density is individuals per area or volume
Population density tells how crowded a population is. Divide the number of individuals by the area or volume they occupy.
N is the number of individuals and A is the area, such as square meters, hectares or square kilometers. For organisms in water or soil, use a volume such as liters. The units are always individuals per unit of area or volume, for example 4 squirrels per hectare.
Density matters because crowding affects how quickly food runs out and how easily disease spreads.
Example 7 — density calculation
Problem: A forest stand of 15 hectares contains 450 sugar maple trees. What is the population density?
Step 1: Use density equals number divided by area.
Step 2: 450 divided by 15 equals 30.
Answer: 30 sugar maples per hectare. Check the units: the number of trees goes on top and the area goes on the bottom. Writing it as 15 divided by 450 would give hectares per tree, a different quantity.
Exponential and logistic growth are models
In exponential growth, a population increases by the same percentage in each time period, so the actual number added grows larger and larger. On a graph this makes a J-shaped curve. It happens when resources seem unlimited, such as bacteria placed in fresh nutrient broth, or a species arriving in a new area with no competitors.
Logistic growth starts out looking exponential, then slows as the population runs short of resources, and finally levels off. Its graph is S-shaped, and the flat top is near the carrying capacity.
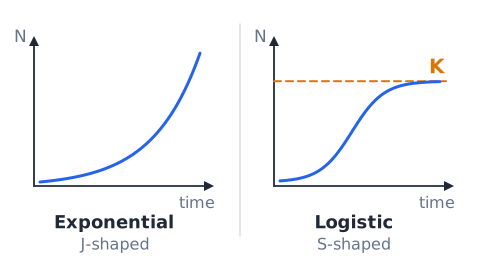
Both are simplified models. Real populations may overshoot, crash or swing up and down with the seasons.
Carrying capacity reflects environmental limits
Carrying capacity, often written K, is the largest population of a species that a habitat can support over the long term under its current conditions. Food, water, nesting sites, space and disease all help set it.
Carrying capacity is not fixed. A drought can lower it by reducing plant growth, while a mild, wet year can raise it. If a population rises above carrying capacity, food becomes scarce, deaths increase and births decrease, and the population tends to fall back.
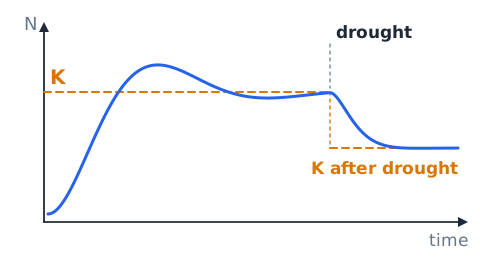
For example, an island may support around 300 deer in a typical year but fewer after a hard winter that kills off shrubs.
Example 8 — read a logistic-growth statement
Problem: A graph of a newly introduced rabbit population shows slow growth for two years, rapid growth for the next three, then a flat line near 1,200 rabbits for the last five years. What can you conclude?
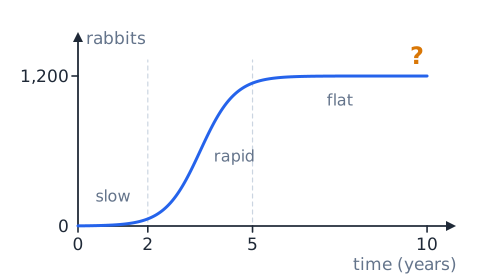
Step 1: The S-shaped curve matches logistic growth.
Step 2: The flat section shows births plus immigration roughly balancing deaths plus emigration.
Step 3: The level where the curve flattens is an estimate of carrying capacity.
Answer: the habitat's carrying capacity for rabbits is about 1,200 under those conditions. It does not mean rabbits stopped breeding; gains and losses are simply about equal.
Density-dependent versus density-independent factors
Density-dependent factors become stronger as a population gets more crowded. Competition for food, the spread of contagious disease, buildup of wastes and more attention from predators all hit a dense population harder than a sparse one. For example, a fungus disease can spread rapidly through a crowded bat roost but barely reach scattered bats.
Density-independent factors affect a population regardless of how crowded it is. A flood, a wildfire, a late frost or a volcanic eruption can kill the same share of a population whether it is large or small.
On a test, crowding words such as overcrowded, dense colony or shared food point to density-dependent factors.
Limiting factors can be biotic or abiotic
A limiting factor is whatever resource or condition is in shortest supply relative to need, so it holds back a population's growth. Improve that one factor and the population can grow until something else becomes limiting.
Limiting factors may be abiotic, such as water in a desert, light on a dark forest floor, or phosphate in a lake. They may also be biotic, such as the number of prey available, the number of nesting cavities in old trees, or a parasite.
For example, wood ducks nest in tree holes. Adding nest boxes to a marsh with plenty of food can raise the duck population, which shows that nest sites were the limiting factor.
Competition involves shared limited resources
Competition happens when two or more organisms need the same resource and there is not enough of it for all of them. The resource may be food, water, light, space, mates or shelter.
Intraspecific competition is between members of the same species, such as two male elk competing for mates or pine seedlings crowding each other for light. Interspecific competition is between different species, such as lions and hyenas competing for the same zebra carcass.
Competition usually harms both competitors to some degree, because each gets less than it would alone. Over time, competing species may split resources, for example by feeding at different heights in a tree or at different times of day.
Predation and herbivory have different feeding roles
In predation, a predator kills and eats another animal, the prey. An osprey snatching a trout and a ladybug eating aphids are both examples. Predators help control prey numbers, and prey develop defenses such as camouflage, speed, spines or toxins.
In herbivory, an animal eats plants or algae. Often the plant survives, as when a cow grazes grass that regrows from its base, though heavy feeding can kill it. Plants defend themselves with thorns, tough leaves and bitter chemicals.
Both relationships help one side and harm the other, but herbivory involves eating producers while predation involves eating animals.
Symbiosis is a broad term; classify effects carefully
Symbiosis means a close, long-term relationship between two different species. Classify it by the effect on each partner.
In mutualism, both partners benefit. A bee collects nectar while carrying pollen between flowers. In commensalism, one benefits and the other is basically unaffected. A barnacle riding on a whale gets transport and access to food, while the whale is hardly affected. In parasitism, one benefits and the other is harmed. A tapeworm absorbs food from inside a dog's intestine.
Shorthand can help: plus/plus for mutualism, plus/zero for commensalism, plus/minus for parasitism. Predation is also plus/minus, but a predator usually kills its prey quickly, while a parasite usually lives on or in its host for a long time.
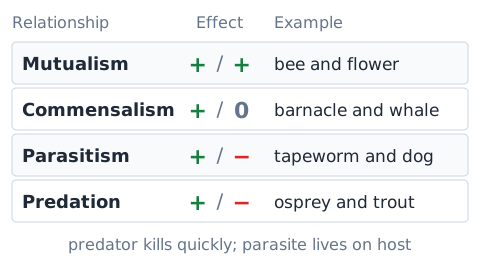
Example 9 — classify relationships
Problem: Classify each pair.
Case A: Oxpecker birds eat ticks off the skin of a rhinoceros. The bird gets food and the rhino loses parasites, so both benefit. This is mutualism.
Case B: Spanish moss hangs from oak branches, getting support and sunlight while taking nothing from the tree. The moss benefits and the oak is unaffected, so this is commensalism.
Case C: A mosquito drinks blood from a horse. The mosquito benefits and the horse loses blood and may be exposed to disease, so this is parasitism.
Method: decide the effect on each partner separately, then match the pattern.
Parasites, pathogens and disease transmission
A parasite lives on or inside a host and takes nutrients from it, usually without killing it right away. Fleas, lice, ticks, tapeworms and mistletoe are parasites.
A pathogen is an organism or agent that causes disease, such as certain bacteria, viruses, fungi and protists. Some parasites are also pathogens.
Disease often passes through ecological links. A vector is an organism that carries a pathogen from one host to another. Deer ticks carry the bacterium that causes Lyme disease. Mosquitoes carry the protist that causes malaria. Changes in the numbers of hosts or vectors can therefore change disease risk. When mice and deer populations rise, tick numbers and Lyme disease cases can rise too.
Ecological succession changes communities over time
Succession is the gradual, fairly predictable change in a community's species over time after a disturbance or the creation of new land.
Early on, pioneer species move in. They grow fast, tolerate harsh conditions and change the site, for example by adding organic matter to the soil or providing shade. Those changes let other species become established, and the newcomers often crowd out the pioneers.
Over decades or centuries, a community may reach a fairly stable state that persists until the next major disturbance. Old textbooks called this a climax community, but ecologists now stress that communities keep changing in response to fires, storms and climate.
Example 10 — primary or secondary succession?
Problem: Classify each case.
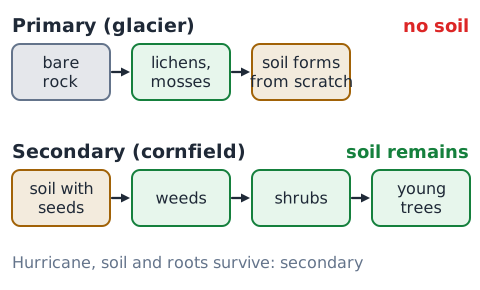
Case A: A retreating glacier exposes bare, scraped rock with no soil. Lichens and mosses appear first. Since soil must form from scratch, this is primary succession.
Case B: A farmer stops plowing a cornfield. Within a year, weeds sprout from seeds in the soil, then shrubs follow, then young trees. Since the soil remained, this is secondary succession.
Case C: A hurricane flattens a coastal forest, but the soil and many roots survive. This is also secondary succession.
Key question: is soil already present? No soil means primary; soil left behind means secondary.
Biodiversity describes multiple kinds of variety
Biodiversity means the variety of life, and it has several levels. Genetic diversity is the variation in genes within one species. Species diversity is the variety of species in an area. Ecosystem diversity is the variety of habitats and communities in a region.
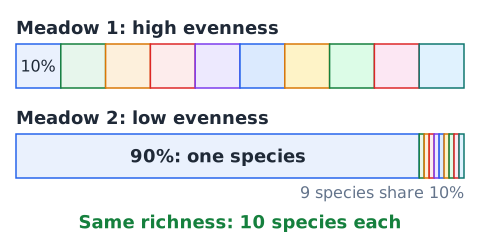
Species diversity itself has two parts. Richness is the number of different species present. Evenness describes how equally individuals are spread among those species.
Imagine two meadows, each with 10 flower species. In one, each species makes up about 10 percent of the flowers. In the other, a single species makes up 90 percent. They have the same richness, but the first has much higher evenness.
Keystone species and trophic cascades
A keystone species has a much bigger effect on its community than its numbers would suggest. Removing it can reshape the entire ecosystem.
Sea otters are a classic example. Otters eat sea urchins, and urchins eat kelp. Where otters were hunted out, urchin populations exploded and grazed kelp forests down to bare rock, and many fish that sheltered in the kelp disappeared. When otters returned, urchins declined and kelp grew back.
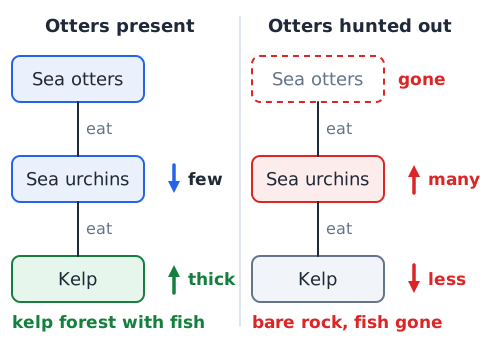
A chain of effects like this, passing down through several trophic levels, is called a trophic cascade.
Native, introduced and invasive species
A native species lives in a region because it arrived or evolved there naturally. An introduced, or nonnative, species was brought to a new region by people, on purpose or by accident.
An invasive species is a nonnative species that spreads and causes harm to the environment, the economy or human health. Zebra mussels in the Great Lakes are an example: they clog water pipes and filter out plankton that native species need. Kudzu vine smothers trees across the southeastern United States.
Many introduced species never become invasive. Most garden crops and ornamental plants stay where they are planted and do little harm. The invasive label needs evidence of both spread and harm.
Example 11 — introduced is not automatically invasive
Problem: Biologists find a nonnative snail in a river. Surveys show it has spread 40 kilometers downstream in five years. No one has yet measured its effect on native snails, fish or plants. How should it be labeled?
Step 1: It came from elsewhere, so it is nonnative or introduced.
Step 2: It is spreading; that is documented.
Step 3: Harm has not been measured, so the evidence does not yet show it is invasive.
Answer: a nonnative species that is spreading and is a possible invader to watch. Calling it invasive requires evidence of harm. This careful wording is often the best answer on a test.
Disturbances and ecosystem resilience
A disturbance is an event that quickly changes an ecosystem, such as a fire, flood, windstorm, drought, landslide or insect outbreak. Disturbances can kill organisms, open up space and release nutrients.
Resilience is an ecosystem's ability to recover its structure and functions after a disturbance. Resistance is its ability to avoid changing much in the first place.
Some ecosystems depend on disturbance. Many prairie grasses regrow quickly from deep roots after a fire, and the fire clears shrubs that would otherwise shade them out. Some pine cones open only in high heat. Ecosystems with high biodiversity often recover faster, because some species survive the disturbance and help others re-establish.
Pollution and habitat fragmentation
Pollution is the release of harmful substances or energy into the environment. Examples include oil spills, pesticides, heavy metals such as mercury, plastic waste, acid rain from sulfur and nitrogen oxides, and even excess heat or light.
Habitat fragmentation happens when roads, farms or housing developments break a large habitat into smaller, isolated patches. Small patches support smaller populations, which are more likely to die out. Animals that need a large range, such as bears or panthers, may be unable to reach mates or food. Edges of patches are also hotter, drier and windier than the interior.
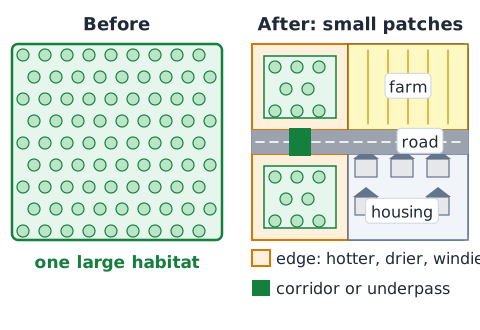
Wildlife corridors and underpasses can reconnect fragments and reduce roadkill.
Excess nutrients and eutrophication
Eutrophication is the over-enrichment of a body of water with nutrients, especially nitrogen and phosphorus. Common sources include fertilizer runoff from farms and lawns, animal manure and untreated sewage.
The added nutrients cause algae and aquatic plants to grow far beyond normal levels. When the algae die, bacteria decompose them. Decomposition uses up oxygen dissolved in the water, especially near the bottom. Fish, crabs and other animals can then suffocate, leaving low-oxygen areas called dead zones.
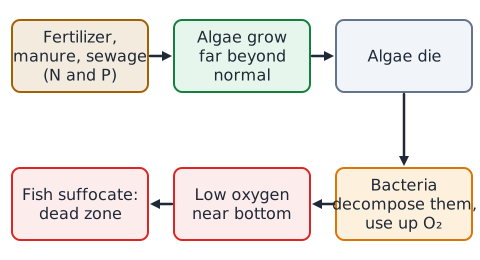
Buffer strips of plants along streams, careful fertilizer use and better wastewater treatment can reduce nutrient runoff.
Example 12 — follow an algal bloom
Problem: After a rainy spring with heavy lawn-fertilizer use, a lake turns bright green in June. By August, dead fish wash up on shore. Explain the chain of events.
Step 1: Rain washed nitrogen and phosphorus from lawns into the lake.
Step 2: These nutrients fed a huge growth of algae, the green bloom.
Step 3: As the algae died, bacteria decomposed the large mass of dead material, using up dissolved oxygen.
Step 4: Low oxygen killed fish.
Answer: nutrient runoff led to an algal bloom, decomposition removed dissolved oxygen, and fish suffocated. The fish died from lack of oxygen, not because the algae were poisonous.
Bioaccumulation versus biomagnification
Bioaccumulation is the buildup of a substance inside a single organism over its lifetime, because the organism takes the substance in faster than it can break it down or excrete it. A fish living in water with traces of mercury gradually accumulates mercury in its tissues as it ages.
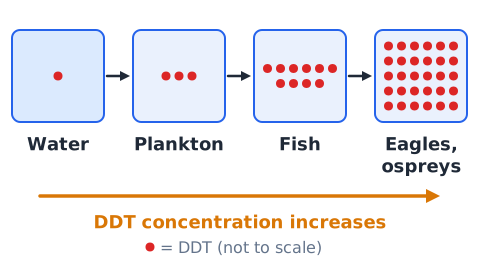
Biomagnification is the increase in concentration of a substance from one trophic level to the next. Each predator eats many contaminated prey, and the substance stays in its body. So concentrations climb up the food chain.
The pesticide DDT showed this clearly. Small amounts in water became higher in plankton, higher still in fish, and highest in fish-eating birds such as eagles and ospreys, whose eggshells thinned and broke.
Photosynthesis and respiration in ecosystem context
Photosynthesis and cellular respiration are roughly opposite processes, and together they drive carbon and energy through ecosystems.
Photosynthesis takes in carbon dioxide and water and, using light energy, produces glucose and oxygen. It occurs in plants, algae and cyanobacteria. Cellular respiration uses glucose and oxygen to release usable energy, producing carbon dioxide and water. It occurs in nearly all living cells, including the cells of plants.
In a healthy forest, photosynthesis during the growing season captures more carbon than the forest's organisms release by respiration, so the forest stores carbon. Oxygen made by producers supports respiration by animals, fungi and microbes.
Climate, weather and geographical distribution
Weather is the short-term state of the atmosphere, such as today's temperature or this week's rain. Climate is the long-term average pattern of weather in a region, usually measured over 30 years or more.
Climate largely decides which organisms can live where. Temperature and rainfall together shape the major land biomes. Hot and wet gives tropical rainforest; cold with a short growing season gives tundra; and low rainfall gives desert.
Latitude, elevation, ocean currents and mountains all influence climate. Climbing a high mountain can resemble traveling toward the poles: forests give way to shrubs, then to alpine meadow, as temperature falls.
Terrestrial and aquatic ecosystems
Terrestrial ecosystems are on land. Their major types, called biomes, include tropical rainforest, temperate deciduous forest, coniferous forest (taiga), grassland, desert and tundra. Temperature and precipitation are the main factors that separate them.
Aquatic ecosystems are in water and cover most of Earth's surface. Here the main factors are depth, light, temperature, dissolved oxygen, flow and salt content. Sunlight only reaches the upper layer of deep water, so most photosynthesis happens near the surface.
Examples of aquatic ecosystems include ponds, rivers, wetlands, coral reefs, kelp forests and the open ocean.
Freshwater, saltwater and salinity tolerance
Salinity is the amount of dissolved salt in water. Freshwater lakes and rivers have very little; the ocean has about 3.5 percent dissolved salts. Estuaries, where rivers meet the sea, have brackish water with salinity in between, and it shifts with the tides.
Most aquatic organisms can tolerate only a narrow salinity range, because salt concentration affects how water moves into and out of their cells by osmosis. A freshwater goldfish placed in seawater loses water and can die.
Some species tolerate wide ranges. Salmon hatch in rivers, grow in the ocean and return to fresh water to spawn, adjusting their bodies at each move. Many estuary plants and crabs also handle changing salinity.
Sampling helps ecologists estimate populations
It is usually impossible to count every organism in a large area, so ecologists sample and then scale up.
A quadrat is a square frame of known size, such as 1 square meter. Researchers place quadrats at random spots, count the organisms inside each, average the counts and multiply by the total area. This works best for plants and slow-moving animals.
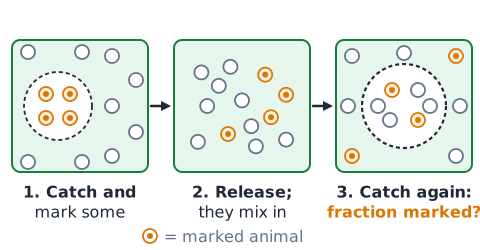
For mobile animals, the mark–recapture method is common. Researchers catch and mark some animals, release them, then later catch another sample and see what fraction is marked.
Estimates are only as good as the sampling. If quadrats are placed only in the best spots, the result will be too high.
Example 13 — estimate density from sample quadrats
Problem: A student counts snails in four randomly placed 1-square-meter quadrats in a marsh of 80 square meters. The counts are 3, 5, 6 and 2. Estimate the total number of snails.
Step 1: Find the mean count per quadrat.
So the estimated density is 4 snails per square meter.
Step 2: Multiply by total area.
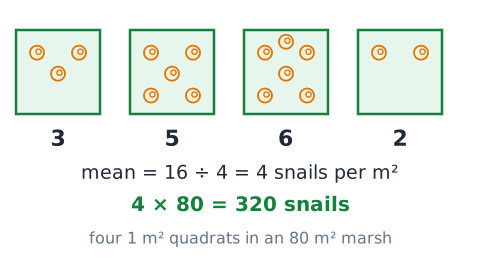
Answer: about 320 snails, assuming the quadrats represent the whole marsh.
Reading ecological graphs
Ecology questions often include a graph. Use the same routine every time.
First, read the title and both axis labels, including units. Is the x-axis time, temperature or distance? Is the y-axis a count, a density or a percentage?
Second, describe the overall shape: rising, falling, flat, J-shaped, S-shaped or cycling.
Third, look at specific points that the question asks about, and read values carefully along the grid lines.
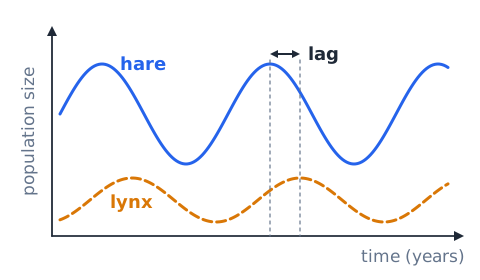
For example, a predator–prey graph from a northern forest often shows lynx numbers rising and falling a year or two after snowshoe hare numbers rise and fall. The lag suggests the lynx population responds to the hare food supply.
Correlation is not automatically causation
A correlation means two variables tend to change together. It does not prove that one causes the other.
Suppose a survey finds more frogs in ponds with more cattails. Cattails might help the frogs by providing shelter. But both might simply favor ponds that are shallow and warm, or a third factor might explain both.
To test cause and effect, scientists run controlled experiments that change one variable while keeping others the same, or they compare many sites and account for other factors. On a test, choose answers that say a pattern is associated with or suggests something, not ones that claim it proves a single cause.
Scientific examples should specify assumptions
Ecological calculations are simplified models, and they depend on stated assumptions. A 10 percent energy transfer is a convenient classroom figure, not a law. A quadrat estimate assumes the samples represent the whole area. A density figure assumes the area was measured correctly.
When an exam question states an assumption, such as assume 15 percent transfer or assume random sampling, use exactly that assumption, even if it differs from the usual rule of thumb.
When you explain your own answer, name your assumptions. Saying about 320 snails, if the quadrats are representative is stronger science than simply saying 320 snails.
Pitfall 1 — confusing food-web arrows with pursuit
The mistake: reading the arrow in rabbit, then coyote as meaning the rabbit chases the coyote, or the rabbit turns into the coyote.
Why it is wrong: food-web arrows show the direction energy and matter move. They point from the food to the eater.
The fix: read every arrow as the phrase is eaten by. Rabbit is eaten by coyote. If the sentence sounds wrong, you have the arrow backward. Arrows pointing into an organism come from its food sources.
Pitfall 2 — assuming nutrients and energy both recycle
The mistake: saying that decomposers return energy to plants, or that energy cycles through an ecosystem the way carbon does.
Why it is wrong: decomposers release nutrients, such as nitrogen and phosphorus, in forms plants can take up again. But the energy stored in dead matter is used by the decomposers themselves and leaves as heat. Plants cannot reuse heat to make food; they need new sunlight.
The fix: remember that matter cycles while energy flows in one direction. Nutrients go around; energy goes through and leaves as heat.
Pitfall 3 — treating a 10% classroom model as an exact law
The mistake: always multiplying by 0.1 at every step, even when a question gives a different percentage, or claiming real ecosystems transfer exactly 10 percent.
Why it is wrong: real transfer efficiencies vary widely between ecosystems and between trophic levels.
The fix: use 10 percent only when the problem states it or asks for the usual estimate. If it says 20 percent and then 5 percent, use those numbers in order.
Pitfall 4 — assuming every nonnative species is invasive
The mistake: treating the words introduced, nonnative, exotic and invasive as if they all mean the same thing.
Why it is wrong: introduced and nonnative describe where a species came from. Invasive adds two more conditions: the species spreads, and it causes measurable harm. Many crops, garden flowers and pets are nonnative but cause no ecological damage.
The fix: check the question for evidence of both spread and harm before choosing invasive. If harm is not shown, the cautious label nonnative is safer.
Pitfall 5 — mixing population and community
The mistake: calling all the birds in a park a population, or calling all the gray squirrels in that park a community.
Why it is wrong: a population has only one species. A community includes all the populations of different species in an area. Birds in a park include robins, sparrows and crows, which are several species.
The fix: ask how many species are involved. One species means population; more than one means community. Add nonliving conditions and you have an ecosystem.
Pitfall 6 — overclaiming from ecological data
The mistake: concluding from one survey that a factor is proven to be the only cause, or that a trend will certainly continue forever.
Why it is wrong: field data are noisy, sample sizes may be small, and many variables change at once. A pattern seen in one season or one place may not hold elsewhere.
The fix: prefer careful wording such as is associated with, suggests or may contribute to. On a test, answers with absolute words like always, proven or every are often wrong in ecology.
ASVAB GS solving routine: classify, trace, calculate
Use three steps for most ecology questions.
Classify: decide what kind of question it is. Is it asking for a level of organization, a feeding role, a relationship type, a cycle step or a calculation? Identify the key words, such as one species, nonliving, both benefit, or no soil.
Trace: if there is a food chain, a web or a cycle, follow it step by step. Count trophic levels from the producer. Follow arrows from food to eater.
Calculate: if numbers appear, write the formula first, such as gains minus losses or number divided by area, then plug in. Check that the answer has sensible units and size.
Finally, eliminate choices that use absolute words or confuse terms.
Calculator-free mental math for simple ecology models
You will not need a calculator for most ecology arithmetic if you use a few tricks.
Taking 10 percent: move the decimal point one place to the left. Two steps of 10 percent means move it two places, so 7,000 becomes 70.
Other percentages: 20 percent is double 10 percent; 5 percent is half of 10 percent. So 5 percent of 3,000 is half of 300, which is 150.
Population change: add all gains, add all losses, then subtract once.
Density: divide by the area, and simplify first if you can. For 360 per 12, divide both by 12 to get 30.
Guided drill 1 — biotic, abiotic and organization
Prompt: Is the salt content of a tide pool biotic or abiotic? Answer: Abiotic; salt content is a chemical condition, not a living thing.
Prompt: Is a mat of algae on a rock biotic or abiotic? Answer: Biotic; algae are living producers.
Prompt: All the sea stars of one species in a tide pool form what level? Answer: A population.
Prompt: Sea stars, mussels, crabs and seaweed in the pool form what level? Answer: A community.
Prompt: That community plus water temperature and wave action form what level? Answer: An ecosystem.
Guided drill 2 — build a food chain
Prompt: Order these into a chain: hawk, grasshopper, grass, frog, snake. Answer: grass, then grasshopper, then frog, then snake, then hawk.
Prompt: Which is the primary consumer? Answer: The grasshopper, because it eats the producer.
Prompt: Which is the secondary consumer? Answer: The frog.
Prompt: Which way does the arrow between frog and snake point? Answer: From frog to snake, because energy moves from the frog into the snake that eats it.
Prompt: What role does a mushroom on a dead hawk play? Answer: Decomposer.
Guided drill 3 — energy under an explicit assumption
Prompt: Producers store 30,000 units. Assuming 10 percent transfer, how much reaches primary consumers? Answer: 3,000 units.
Prompt: How much reaches secondary consumers? Answer: 300 units.
Prompt: A different model says producers have 1,200 units and 25 percent passes to primary consumers. How much is that? Answer: 300 units.
Prompt: If 4 percent of that then passes to secondary consumers, how much is that? Answer: 12 units.
Prompt: Where did most of the missing energy go? Answer: It was used for life processes and lost as heat.
Guided drill 4 — growth and carrying capacity
Prompt: A population graph forms a J shape. What growth model fits? Answer: Exponential growth, with resources not yet limiting.
Prompt: A graph rises, then levels off. What model fits, and what does the flat level suggest? Answer: Logistic growth; the flat level estimates carrying capacity.
Prompt: A frog population stays near 500 for years. Are frogs still being born? Answer: Yes; births and immigration roughly balance deaths and emigration.
Prompt: A drought cuts food supply. What likely happens to carrying capacity? Answer: It falls, at least for a time.
Guided drill 5 — identify a nutrient-pollution mechanism
Prompt: Which two nutrients most often drive algal blooms in lakes and coastal waters? Answer: Nitrogen and phosphorus.
Prompt: Why does dissolved oxygen fall after a bloom, rather than rise? Answer: When the algae die, decomposing bacteria use up large amounts of oxygen.
Prompt: What is a low-oxygen area in a bay or gulf called? Answer: A dead zone.
Prompt: Name one way to reduce the problem. Answer: Plant buffer strips along streams, use less fertilizer, or improve sewage treatment.
Prompt: Is this process called biomagnification? Answer: No. It is eutrophication; biomagnification is about toxins building up along a food chain.
Guided drill 6 — invasive species and cautious inference
Prompt: A plant from Asia grows in a botanical garden and has never spread. Is it invasive? Answer: No; it is introduced but shows no spread or harm.
Prompt: A beetle from overseas spreads across three states and kills millions of ash trees. Is it invasive? Answer: Yes; it is nonnative, spreading and causing clear harm.
Prompt: Biologists see a new fish spreading but have not studied its effects. Best label? Answer: Nonnative and spreading; harm not yet established.
Prompt: Why should we avoid stronger claims? Answer: The evidence does not yet show ecological harm.
Exam review — core relationships and formulas
Ecology is the study of how organisms interact with each other and with their environment. The levels go organism, population (one species), community (many species), ecosystem (community plus abiotic factors) and biosphere.
Producers capture energy, mostly from sunlight. Consumers are numbered by how many feeding steps they are above producers. Decomposers such as fungi and bacteria return nutrients. Food-web arrows point from the food to the eater.
Energy flows one way and is lost as heat at each step; a rough model is 10 percent transfer. Matter cycles: carbon through photosynthesis and respiration, nitrogen through fixation, nitrification and denitrification, and phosphorus mainly through rock and soil.
Population change equals births plus immigrants minus deaths minus emigrants. Density equals number divided by area. Carrying capacity is where logistic growth levels off.
Relationships: competition, predation, mutualism, commensalism and parasitism. Succession is primary on bare rock and secondary when soil remains. Invasive means nonnative plus spread plus harm. Correlation alone does not prove causation.
 English ▾